


 42-43 / 76

Página
33
de
61
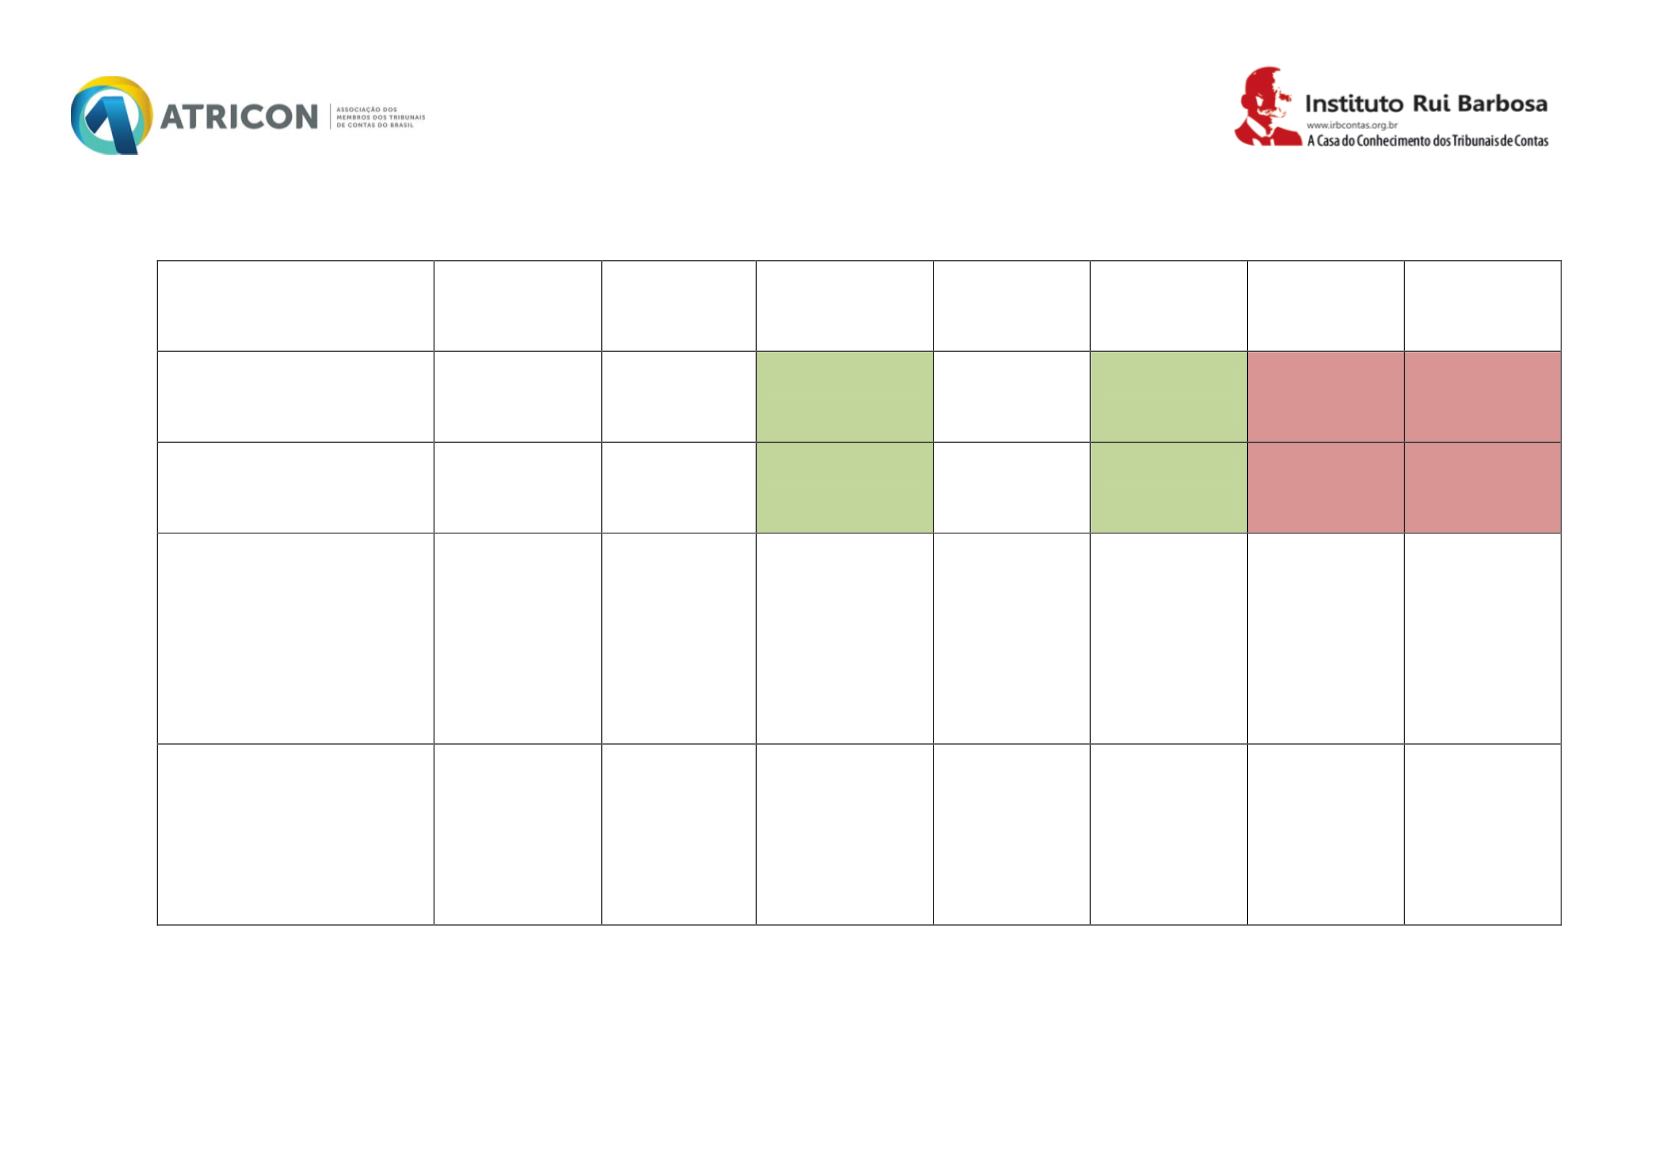
Tabela 12 – Número de Municípios em cada mesorregião com IDEB superior ou igual à meta para 2015
Centro
Ocidental
Centro
Oriental
Metropolitana
de Porto
Alegre
Nordeste
Noroeste
Sudeste
Sudoeste
IDEB 2015 Anos iniciais
≥ 5,2
(% de Municípios ≥ 5,2)¹
13
(76,5%)
26
(83,9%)
52
(70,3%)
23
(79,3%)
86
(86,0%)
4
(20,0%)
6
(33,3%)
IDEB 2015 Anos finais
≥ 4,7
(% de Municípios ≥ 4,7)¹
4
(26,7%)
9
(50,0%)
19
(32,2%)
13
(56,5%)
24
(44,4%)
2
(13,3%)
0
(0,0%)
Investimento por aluno no
ensino fundamental -
média dos Municípios que
atenderam à meta
referente ao IDEB de
2015, anos iniciais e/ou
finais³
R$ 9.043,07
R$ 8.220,57
R$ 7.813,05
R$ 9.266,48
R$ 8.888,43
R$ 9.671,46
R$ 7.578,99
Investimento por aluno no
ensino fundamental -
média dos Municípios que
não
atenderam à meta
referente ao IDEB de
2015
4
R$ 10.841,53
R$ 10.416,28
R$ 9.072,52
R$ 11.662,17 R$ 11.219,01 R$ 8.976,72
R$ 9.360,77
(continua)